views
term
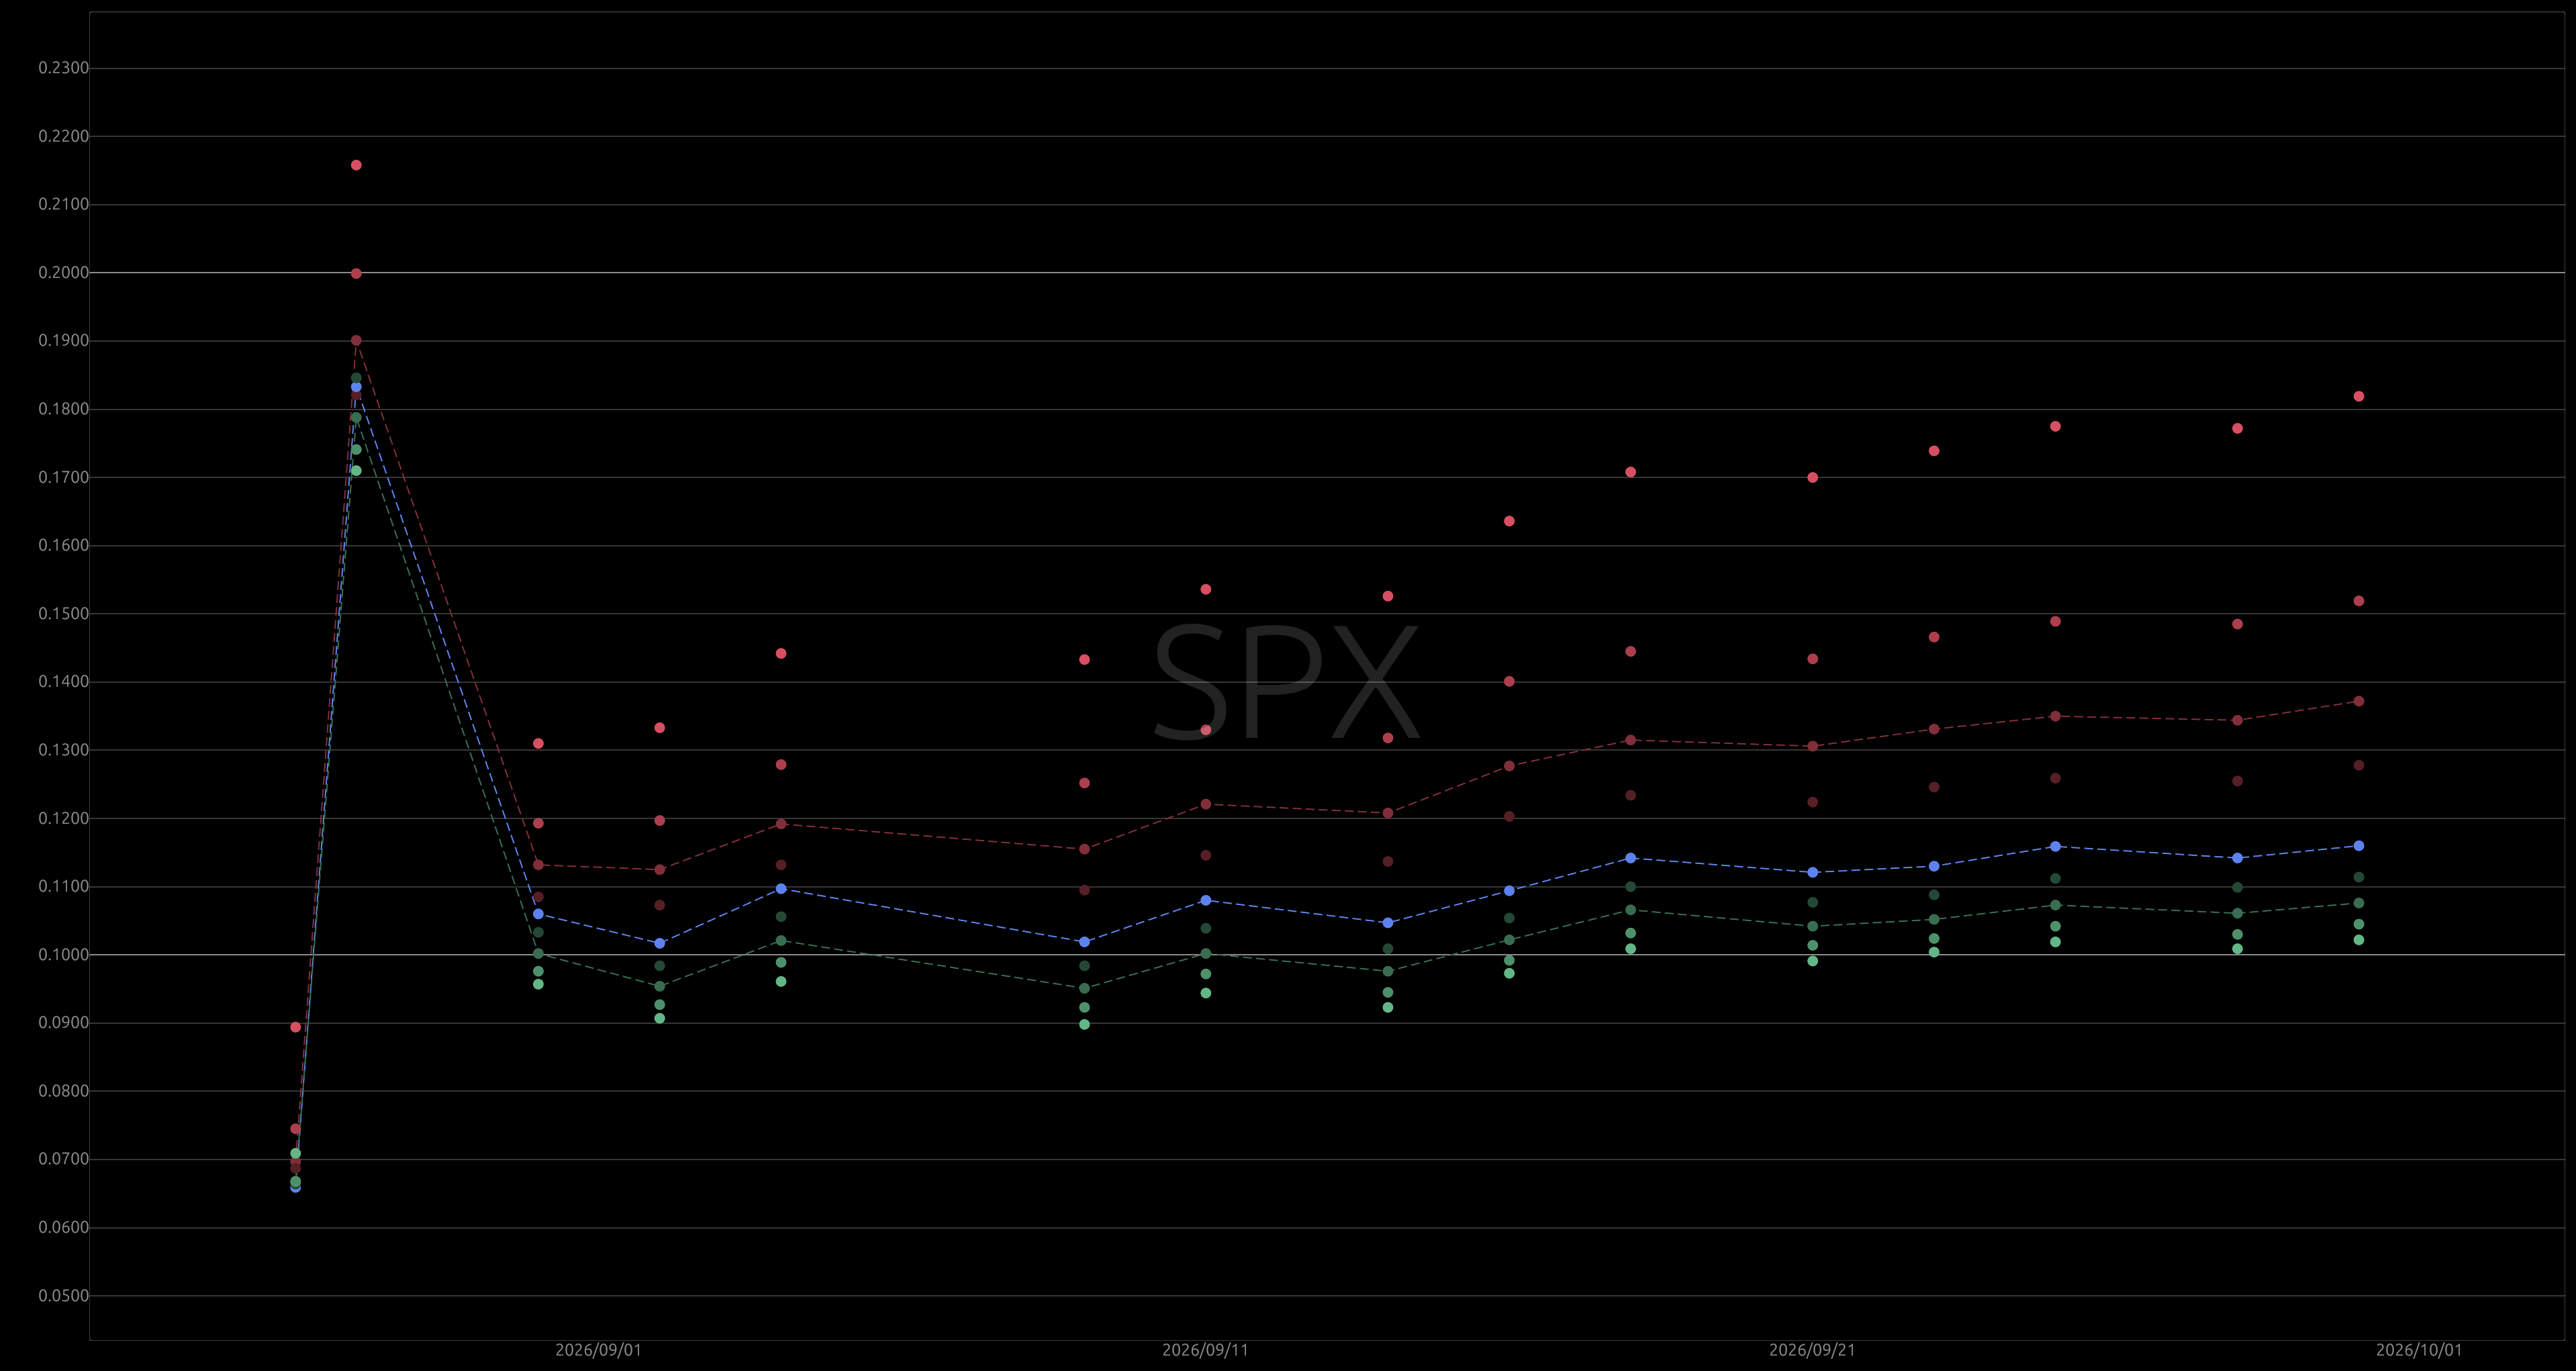
Fixed-delta implied volatility compared across all live expirations.
what it shows
The term view displays fixed-delta implied volatility across all active expirations simultaneously. It provides a real-time snapshot of the term structure and term skew from 0DTE out to distant maturities.
chart elements
The x-axis displays expiration dates in chronological order. The y-axis displays annualized implied volatility.
delta points (dots)
The chart plots nine fixed-delta volatility points for each expiration date:
- Downside Puts (.10Δ to .40Δ): Red points. The deep out-of-the-money .10Δ wing has the brightest red shade and darkens toward ATM.
- At-The-Money (.50Δ): Center reference point.
- Upside Calls (.60Δ to .90Δ): Green points. The deep out-of-the-money .90Δ wing has the brightest green shade and darkens toward ATM.
bracket connector lines (dashed lines)
Three dashed lines trace through the points across expirations to outline term structure shape:
- .30Δ Line: Red dashed line through .30 delta downside points.
- ATM Line: Center dashed line through at-the-money (.50 delta) points.
- .70Δ Line: Green dashed line through .70 delta upside points.
These three lines create a visual bracket. They show curve slope and wing skew across tenors without visual noise.
term structure states
| State | Surface Behavior |
|---|---|
| contango | Near-term volatility trades below longer maturities in an upward-sloping curve. |
| backwardation | Short-dated volatility spikes above longer tenors and inverts the curve. |
| flat | Volatility levels are uniform across all expiration horizons. |
See also: term controls →