curve
The full volatility smile across strikes for selected expirations.
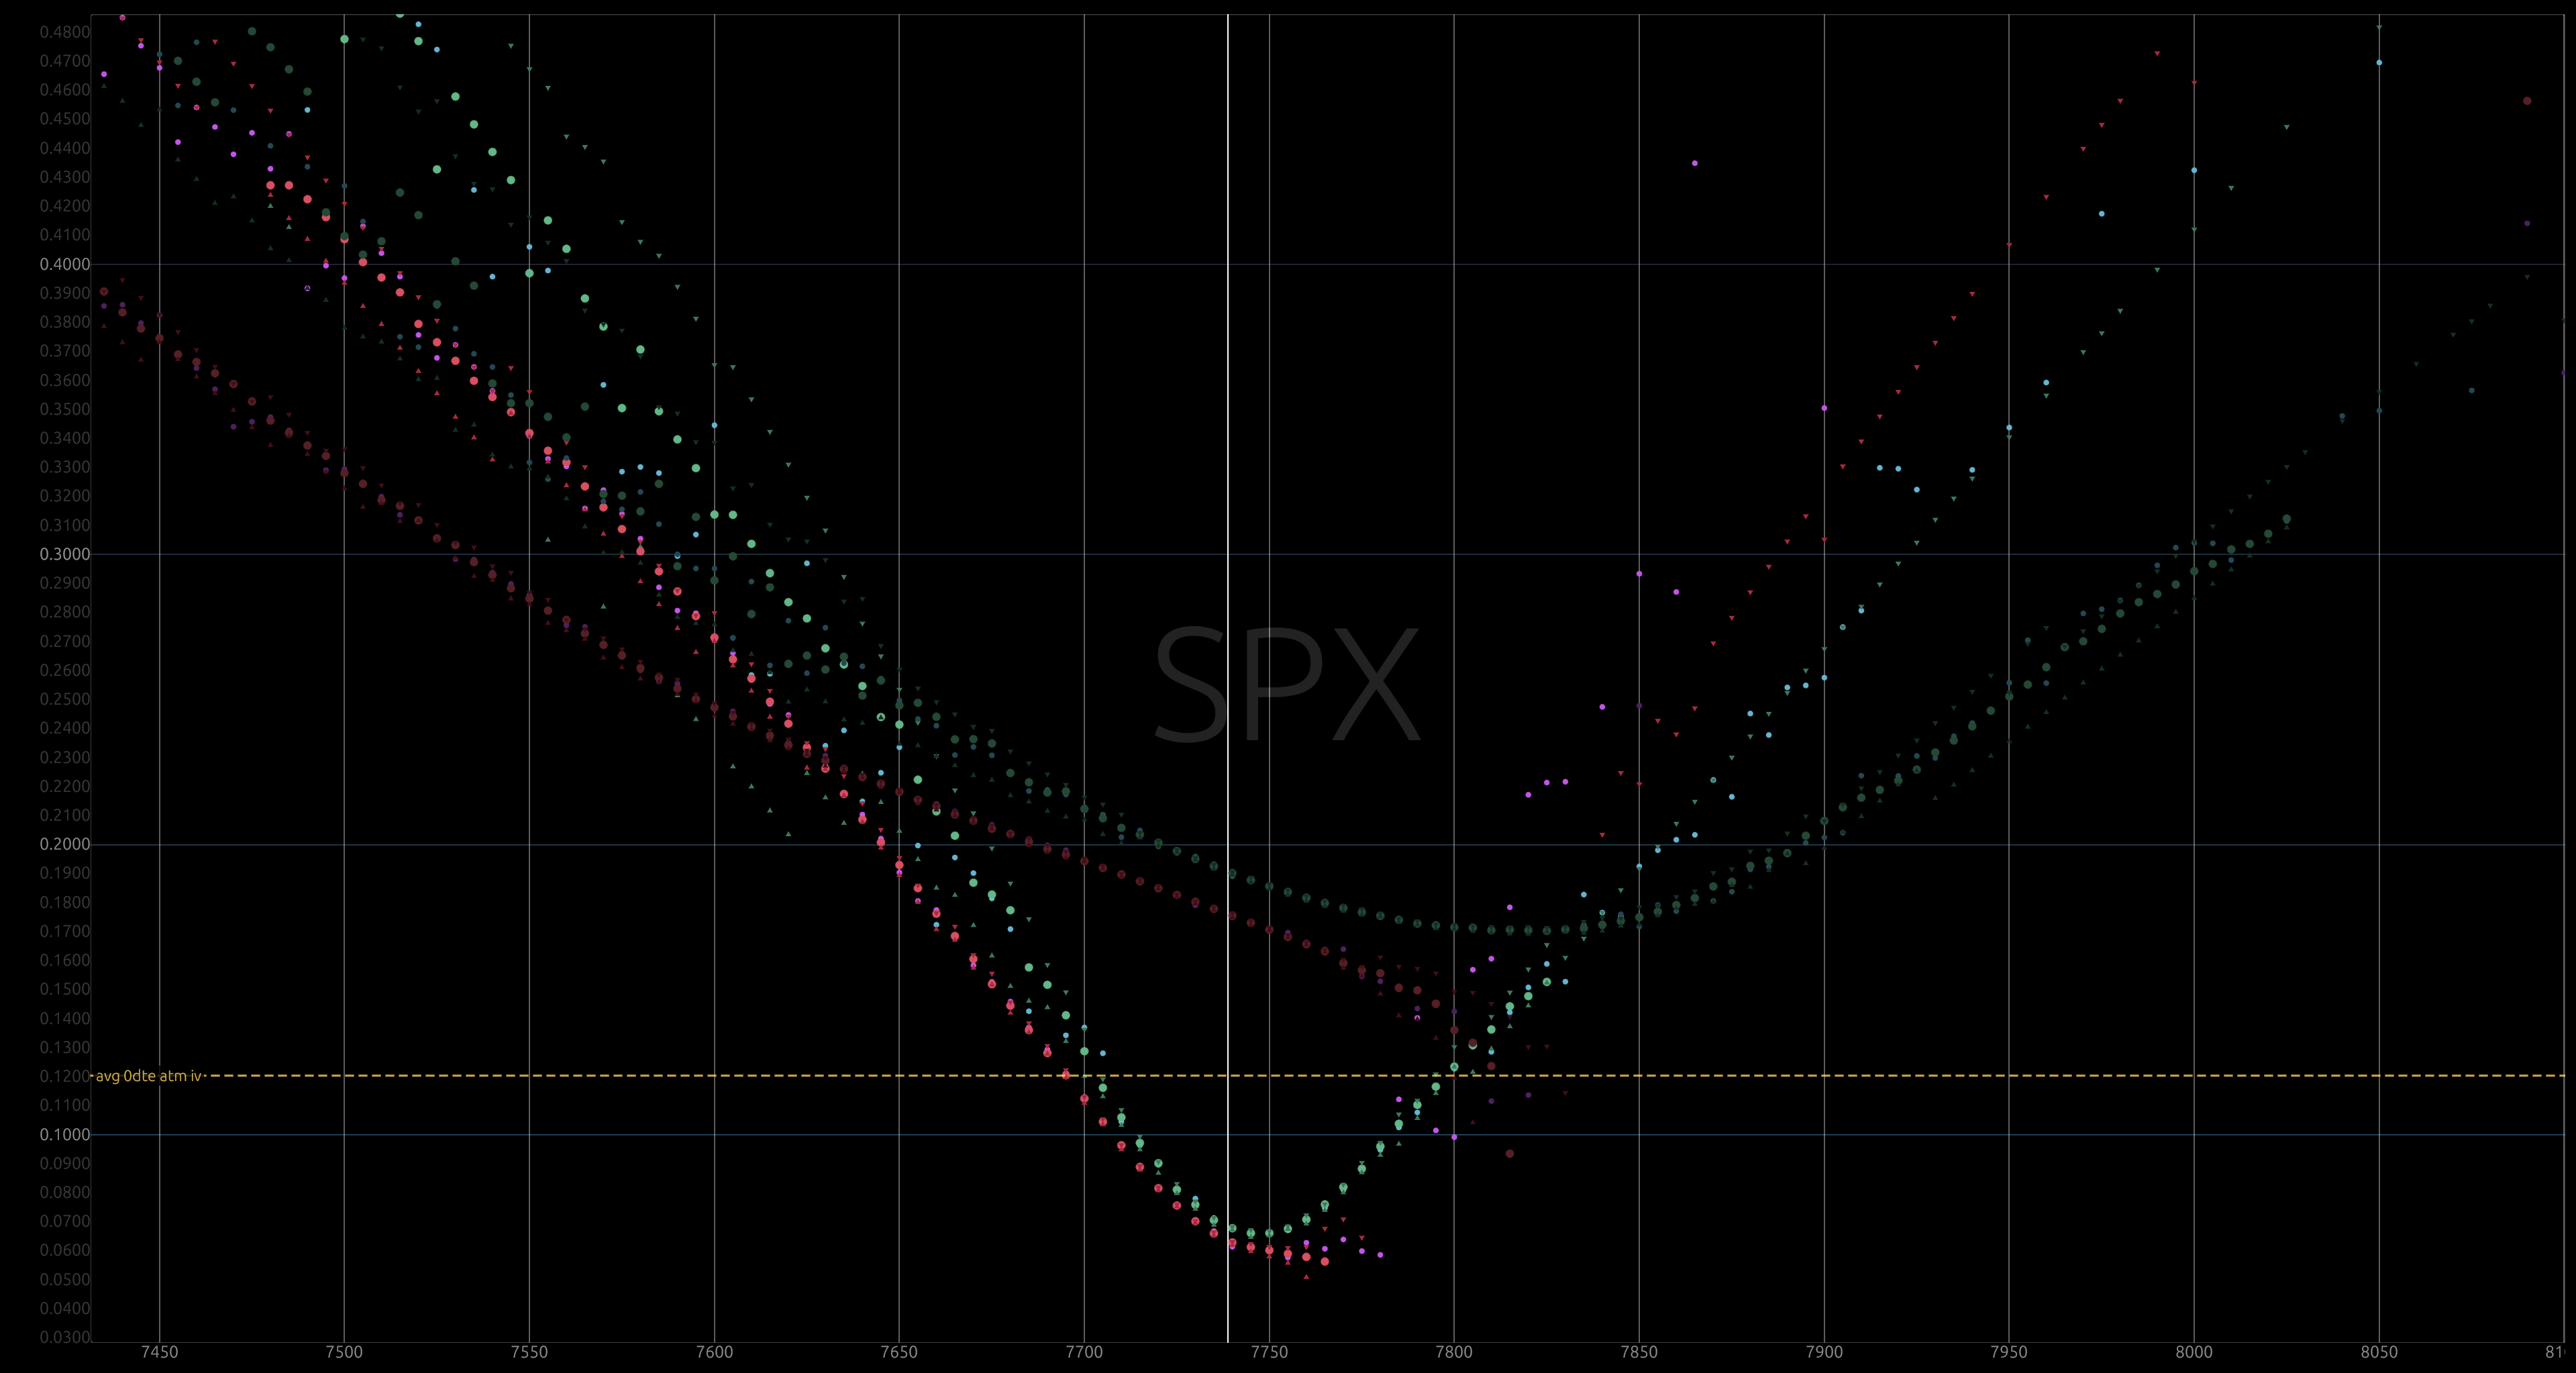
what it shows
The curve view renders real-time implied volatility across strike prices. It displays live market maker quotes, executed trades, and bid-ask spreads across selected expirations.
chart elements
The x-axis displays option strike prices. The y-axis displays annualized implied volatility.
dealer curves (quotes)
Dealer curves show implied volatility from posted market maker quotes, kept up to date using our in-house theos.
- Large Dots: Dealer implied volatility for each strike price. Green dots show calls and red dots show puts by default.
paper curves (trades)
Paper curves show implied volatility from actual transacted trades, kept up to date using our in-house theos.
- Small Dots: Paper implied volatility from transacted volume. Paper points render at a smaller radius and lower opacity than dealer points.
bid and ask spreads (arrows)
Bid and ask markers display the quoted spread in volatility terms for the nearest selected expiration:
- Up Arrows (▲): Bid implied volatility calculated from the current bid price.
- Down Arrows (▼): Ask implied volatility calculated from the current ask price.
The vertical gap between the up arrow and down arrow shows the market maker spread width at that strike.
error bars and session stats
When you enable error bars in pane controls, the view overlays session statistics for each strike:
- Vertical Whiskers: The full session range between the lowest and highest theoretical volatility.
- Cross Markers (+): The cumulative session average theoretical volatility.
reference lines
- Vertical White Line: The current spot price of the underlying asset.
- Dashed Yellow Line: The session average 0DTE at-the-money straddle implied volatility.
- Horizontal Grid Lines: Fixed implied volatility reference levels at 10% intervals (0.10 to 0.80).
See also: curve controls →