views
fixed delta vols
Implied volatility tracked through time at fixed delta levels.
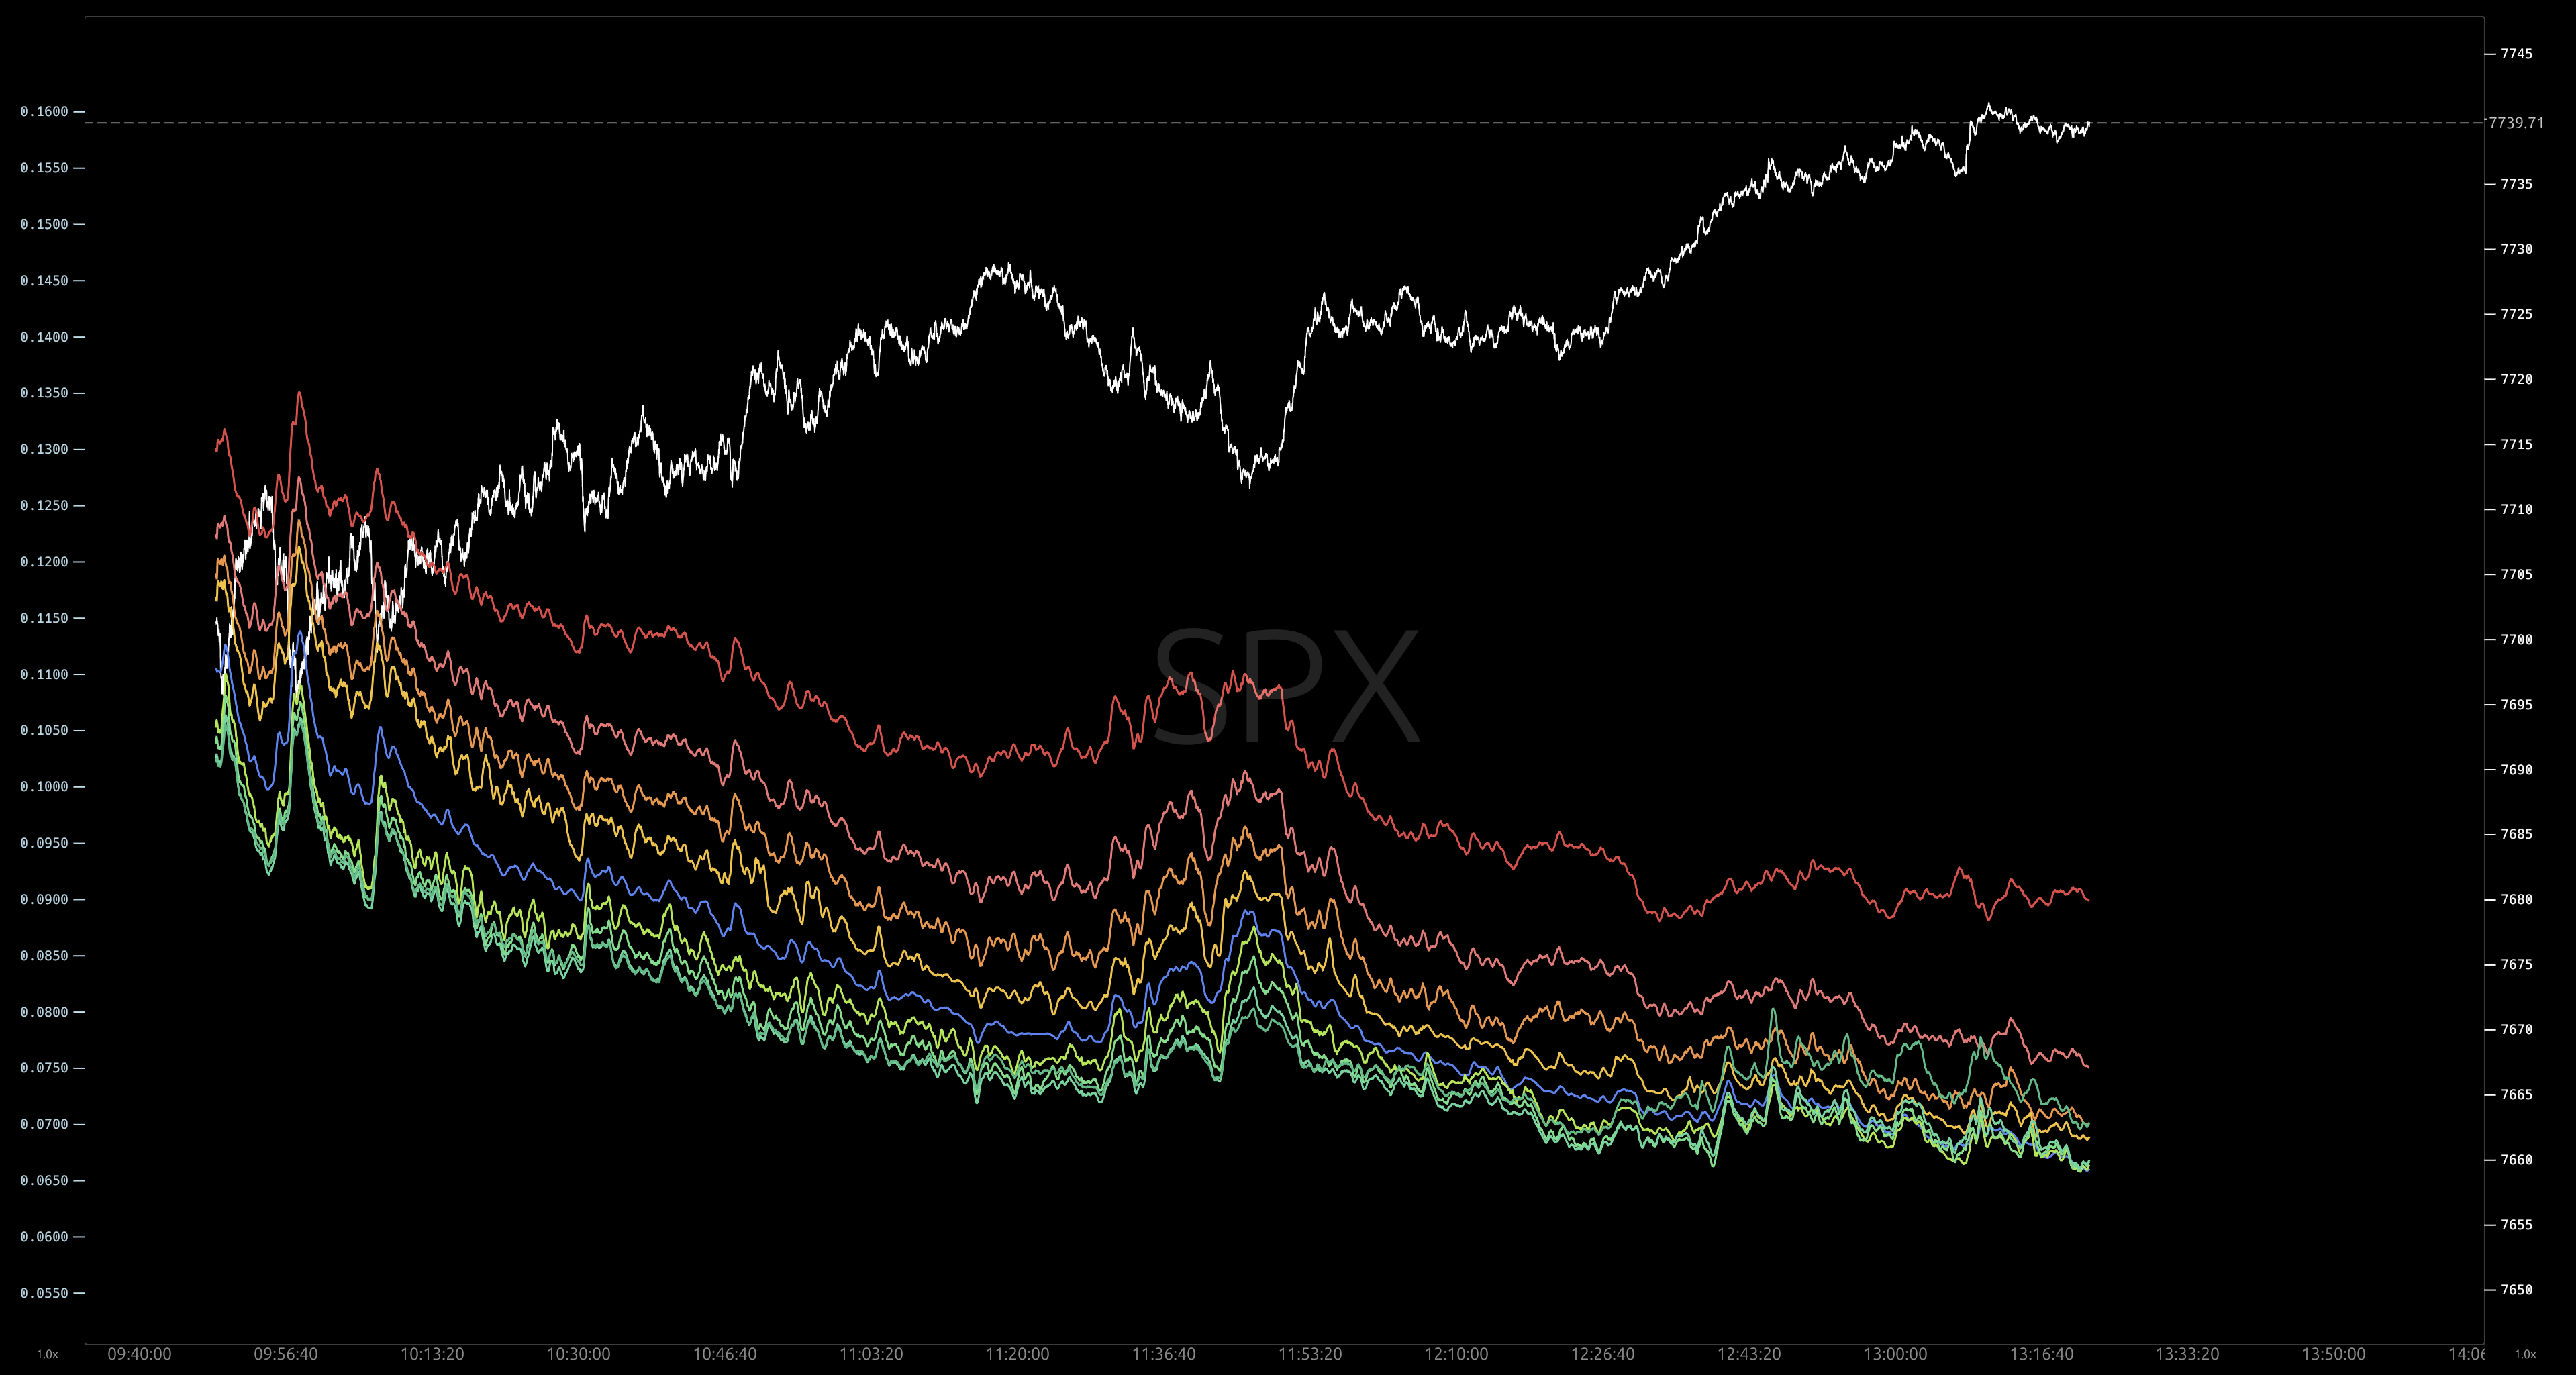
what it shows
Fixed Delta Vols (FDV) tracks implied volatility through time at specific delta levels. Each line follows a constant delta position on the options curve as underlying spot moves.
The view applies a 30-second rolling average to suppress tick noise. It shows whether implied volatility moves across the whole surface or at specific wings.
delta levels
Nine delta levels track the surface from deep puts to deep calls:
| Delta | Description | Color Scheme |
|---|---|---|
| -0.10Δ | Deep OTM put tail | Vibrant red |
| -0.20Δ | OTM put wing | Light coral |
| -0.30Δ | Put side | Warm orange |
| -0.40Δ | Near put | Amber yellow |
| ATM | At-the-money baseline | Electric blue |
| +0.40Δ | Near call | Lime green |
| +0.30Δ | Call side | Emerald light |
| +0.20Δ | OTM call wing | Mint green |
| +0.10Δ | Deep OTM call tail | Emerald green |
reading the chart
The x-axis displays time. The y-axis displays annualized implied volatility (or ratio when ATM normalization is on).
visual elements
- Delta Lines: Solid colored curves that show implied volatility at each delta level.
- Spot Line: Solid white line that shows the normalized underlying price.
- Multi-DTE Shading: The nearest expiration renders at full brightness. Distant maturities render with reduced opacity.
surface behaviors
- Parallel shifts: All delta lines move together as baseline market volatility shifts.
- Wing expansion: Wing lines move higher while ATM volatility stays flat.
- Asymmetric shifts: Put deltas or call deltas reprice independently on one side of the surface.
See also: fixed delta vols controls →