tilt
The steepness of the volatility curve, measured independently for dealer and paper flow.
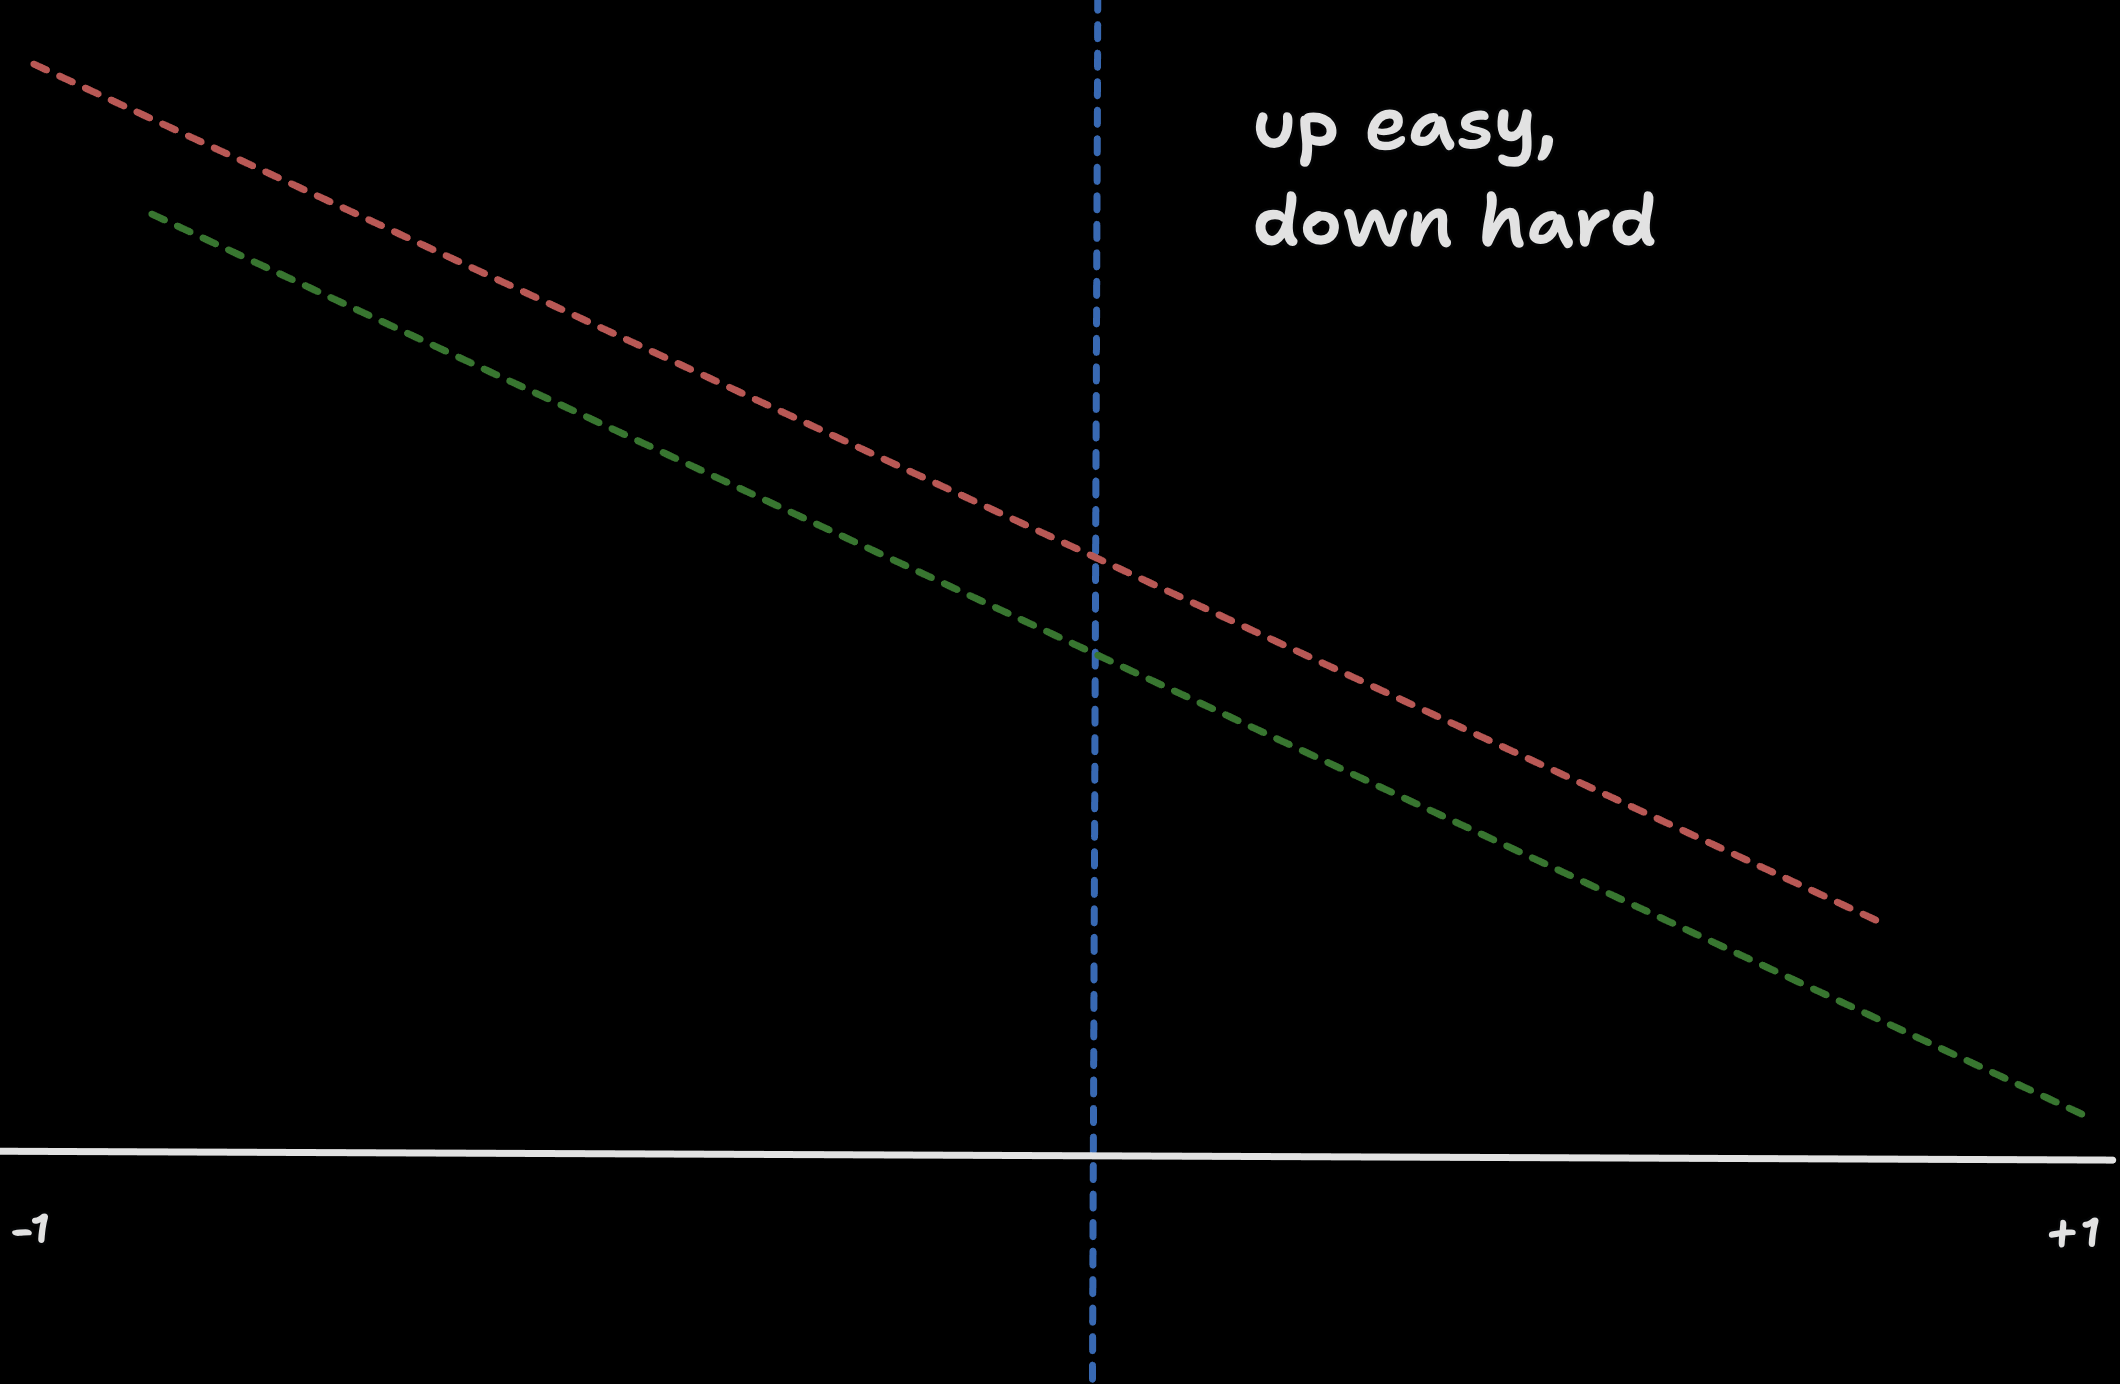
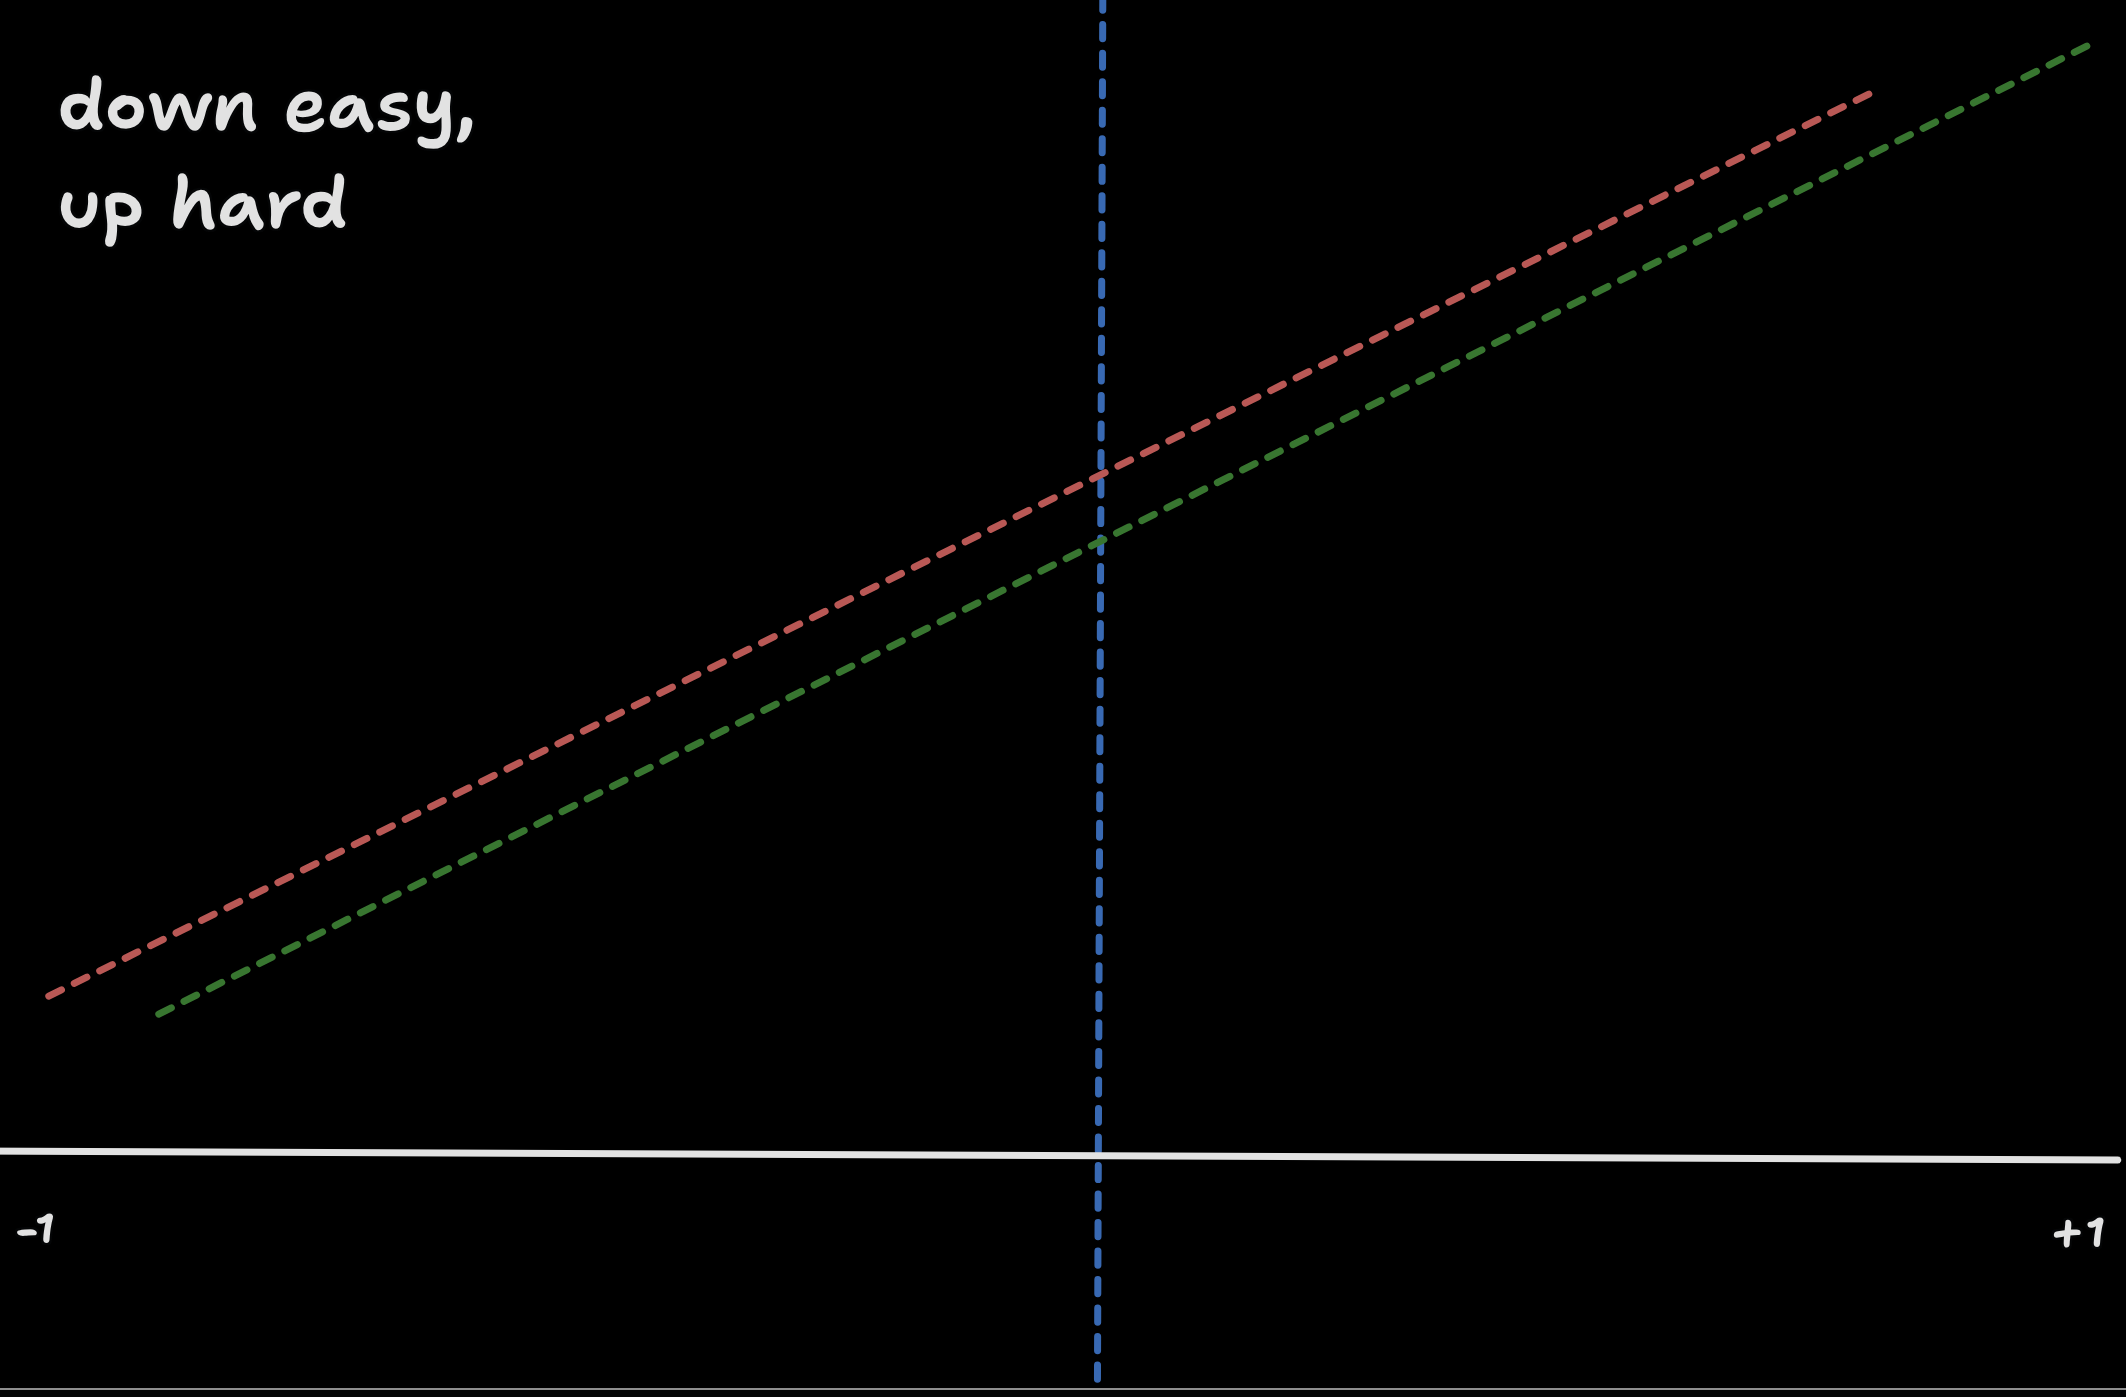
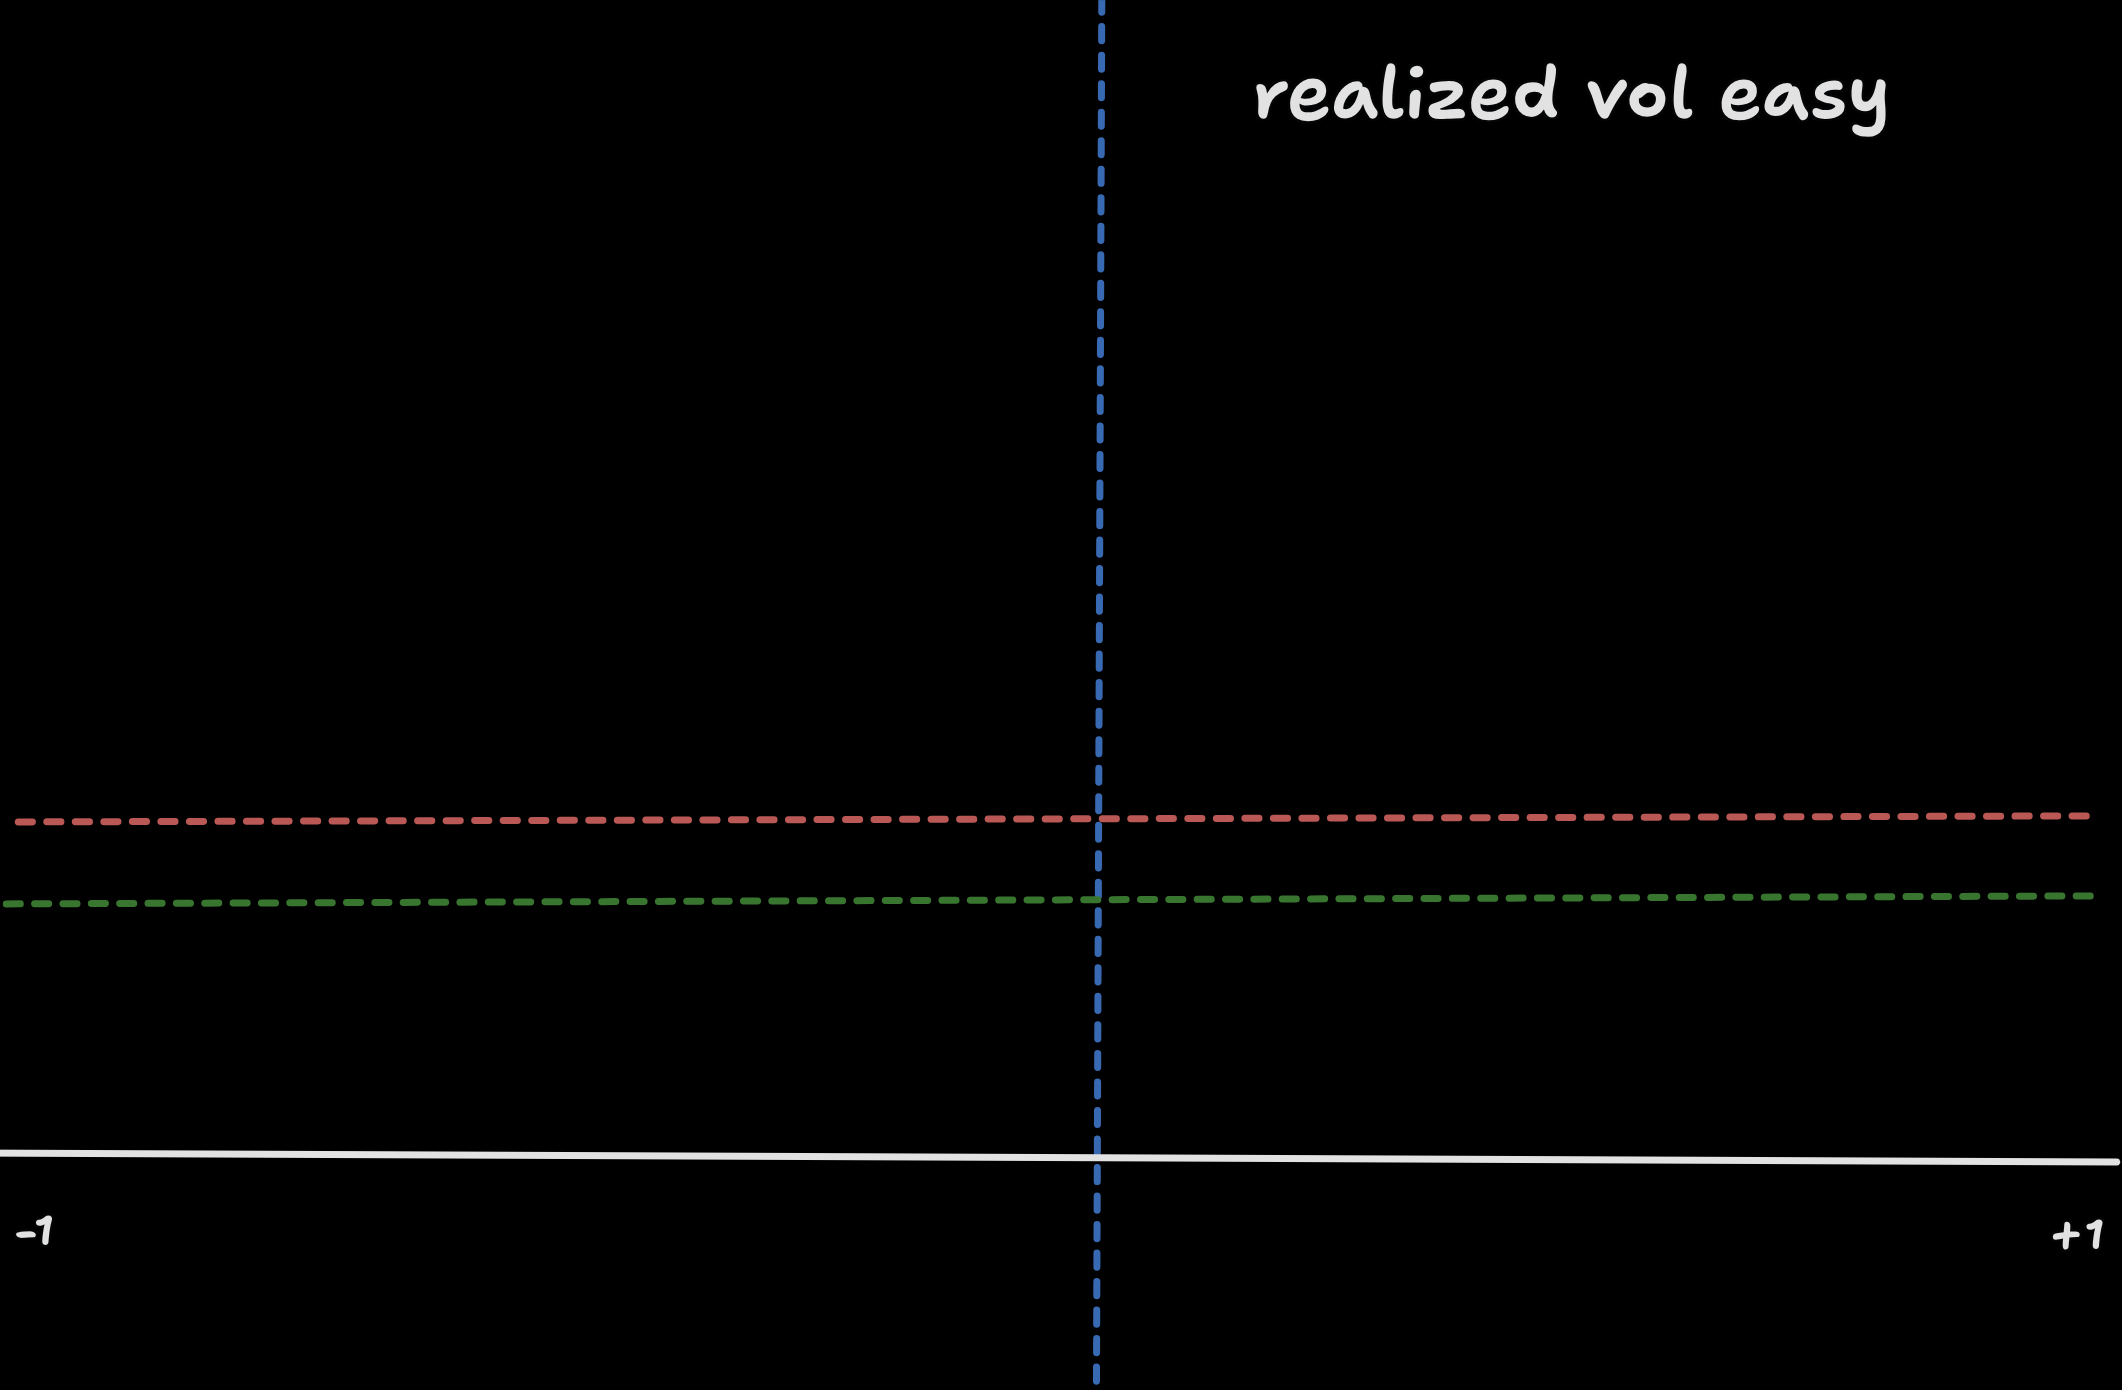
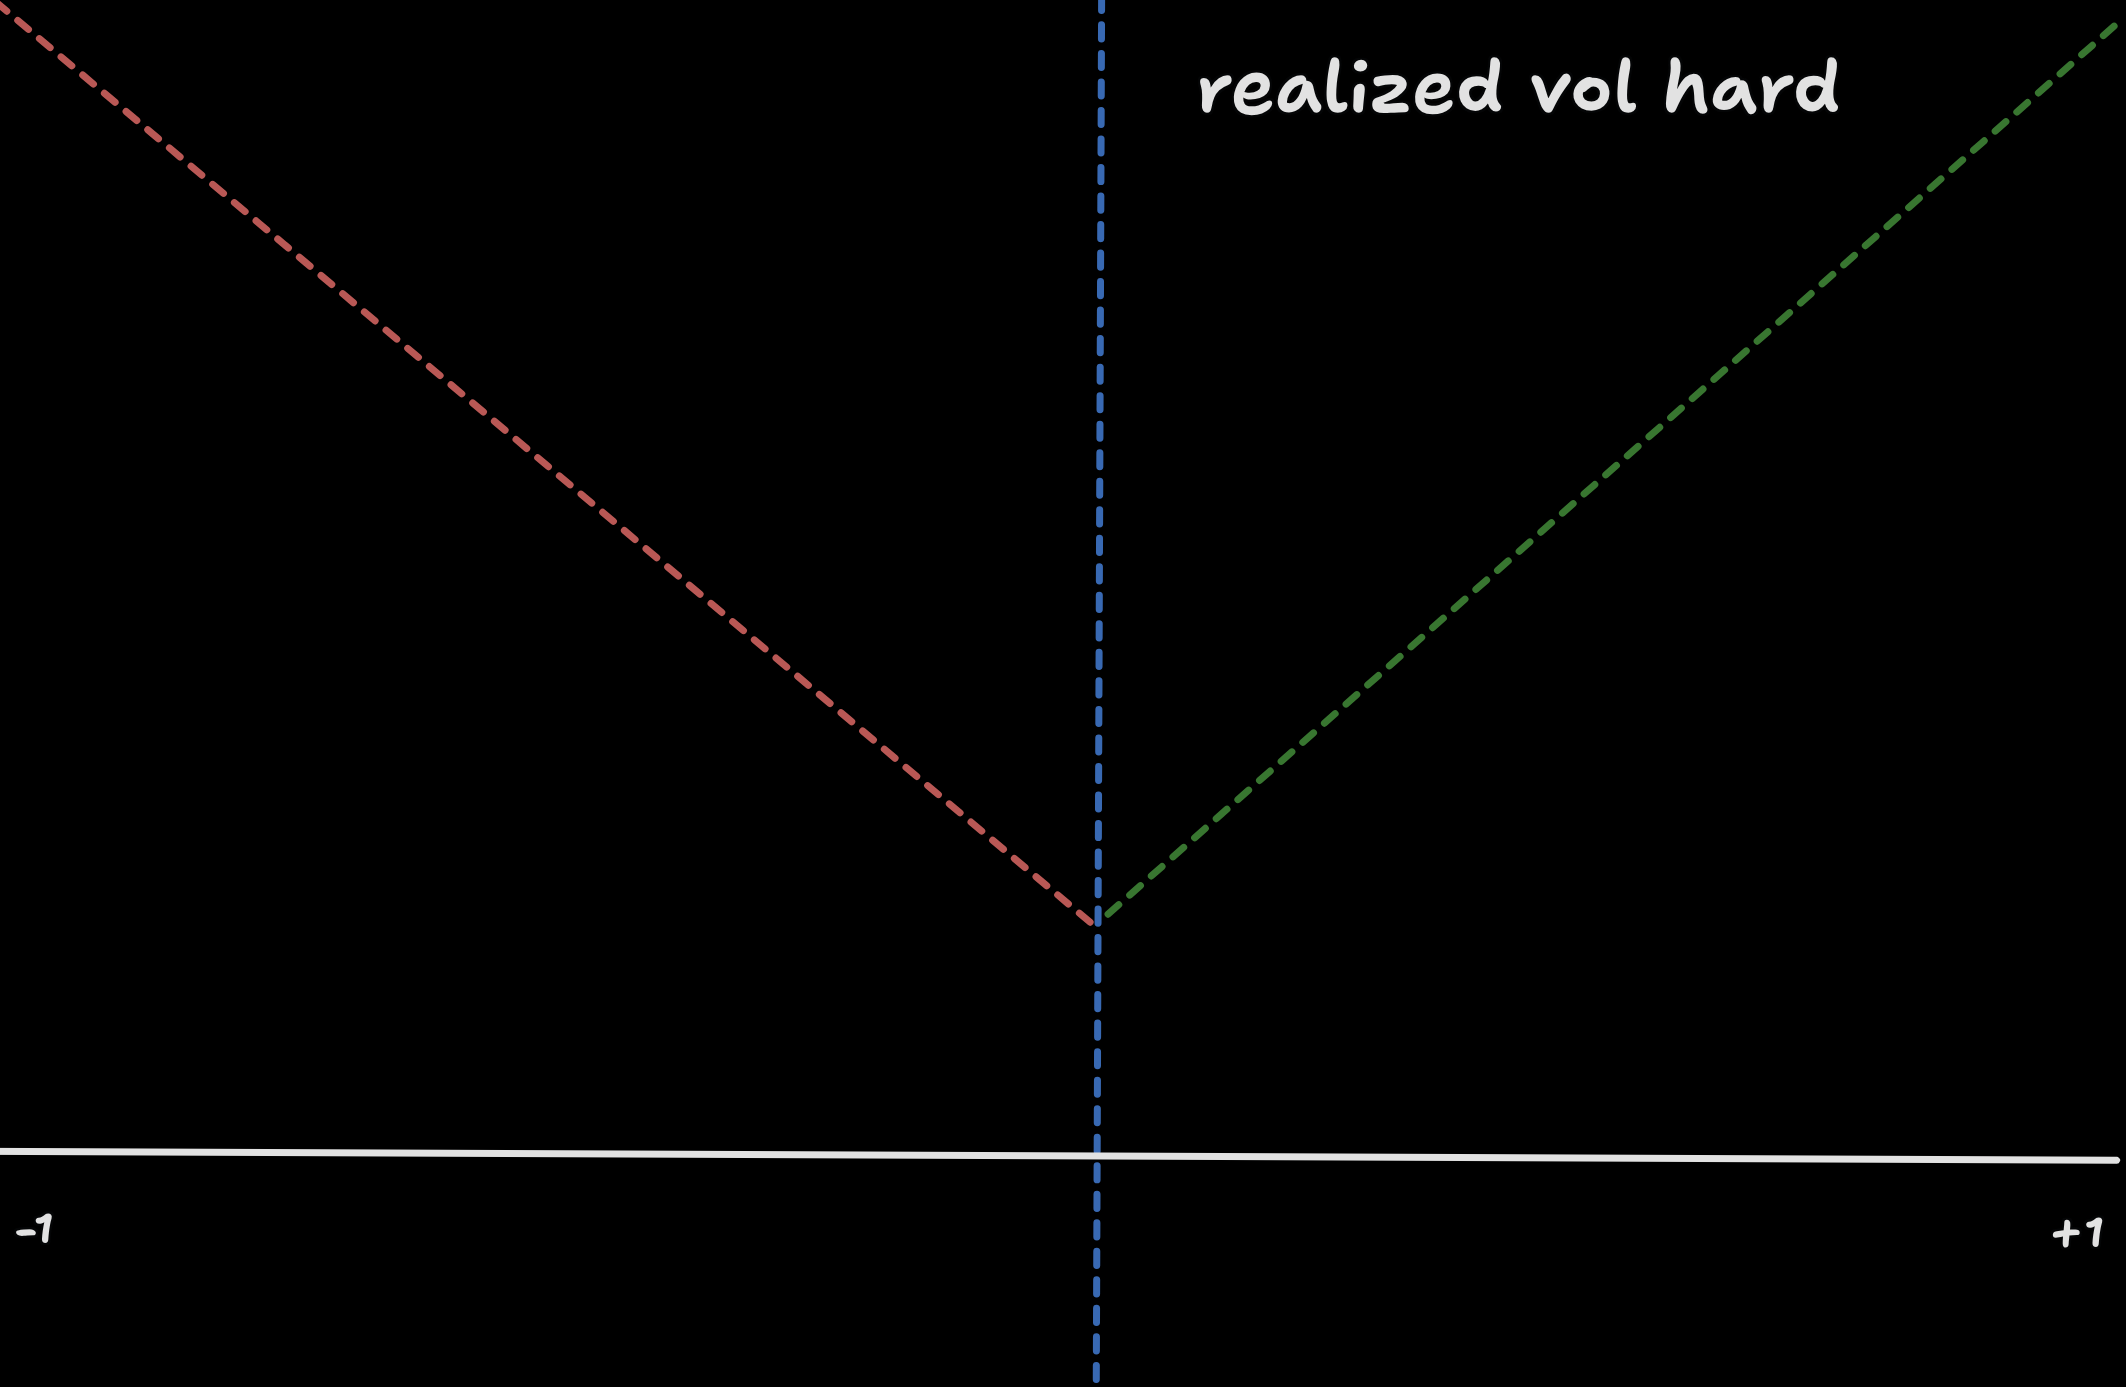
what it shows
Tilt is skewbot's normalized measure of the steepness of the volatility curve. High tilts indicate that volatility is increasingly expensive as we go up in strike price; low tilts indicate that volatility gets cheaper as we go up in strike price. Because these measurements are normalized, tilts can be compared across tickers and across expirations.
Rather than measuring the entire smile as a single relative value, skewbot tracks the steepness of the upside (call-side) and downside (put-side) curves independently. This allows you to see how the pricing structure of upside optionality and downside protection evolve on their own terms.
dealer vs. paper
Dealer — Reflects quoted prices.
Paper — Reflects transacted prices.
When dealer and paper tilt diverge, it can indicate a transfer of risk. When they move together, directional pressure is more uniform across the market.
reading the chart
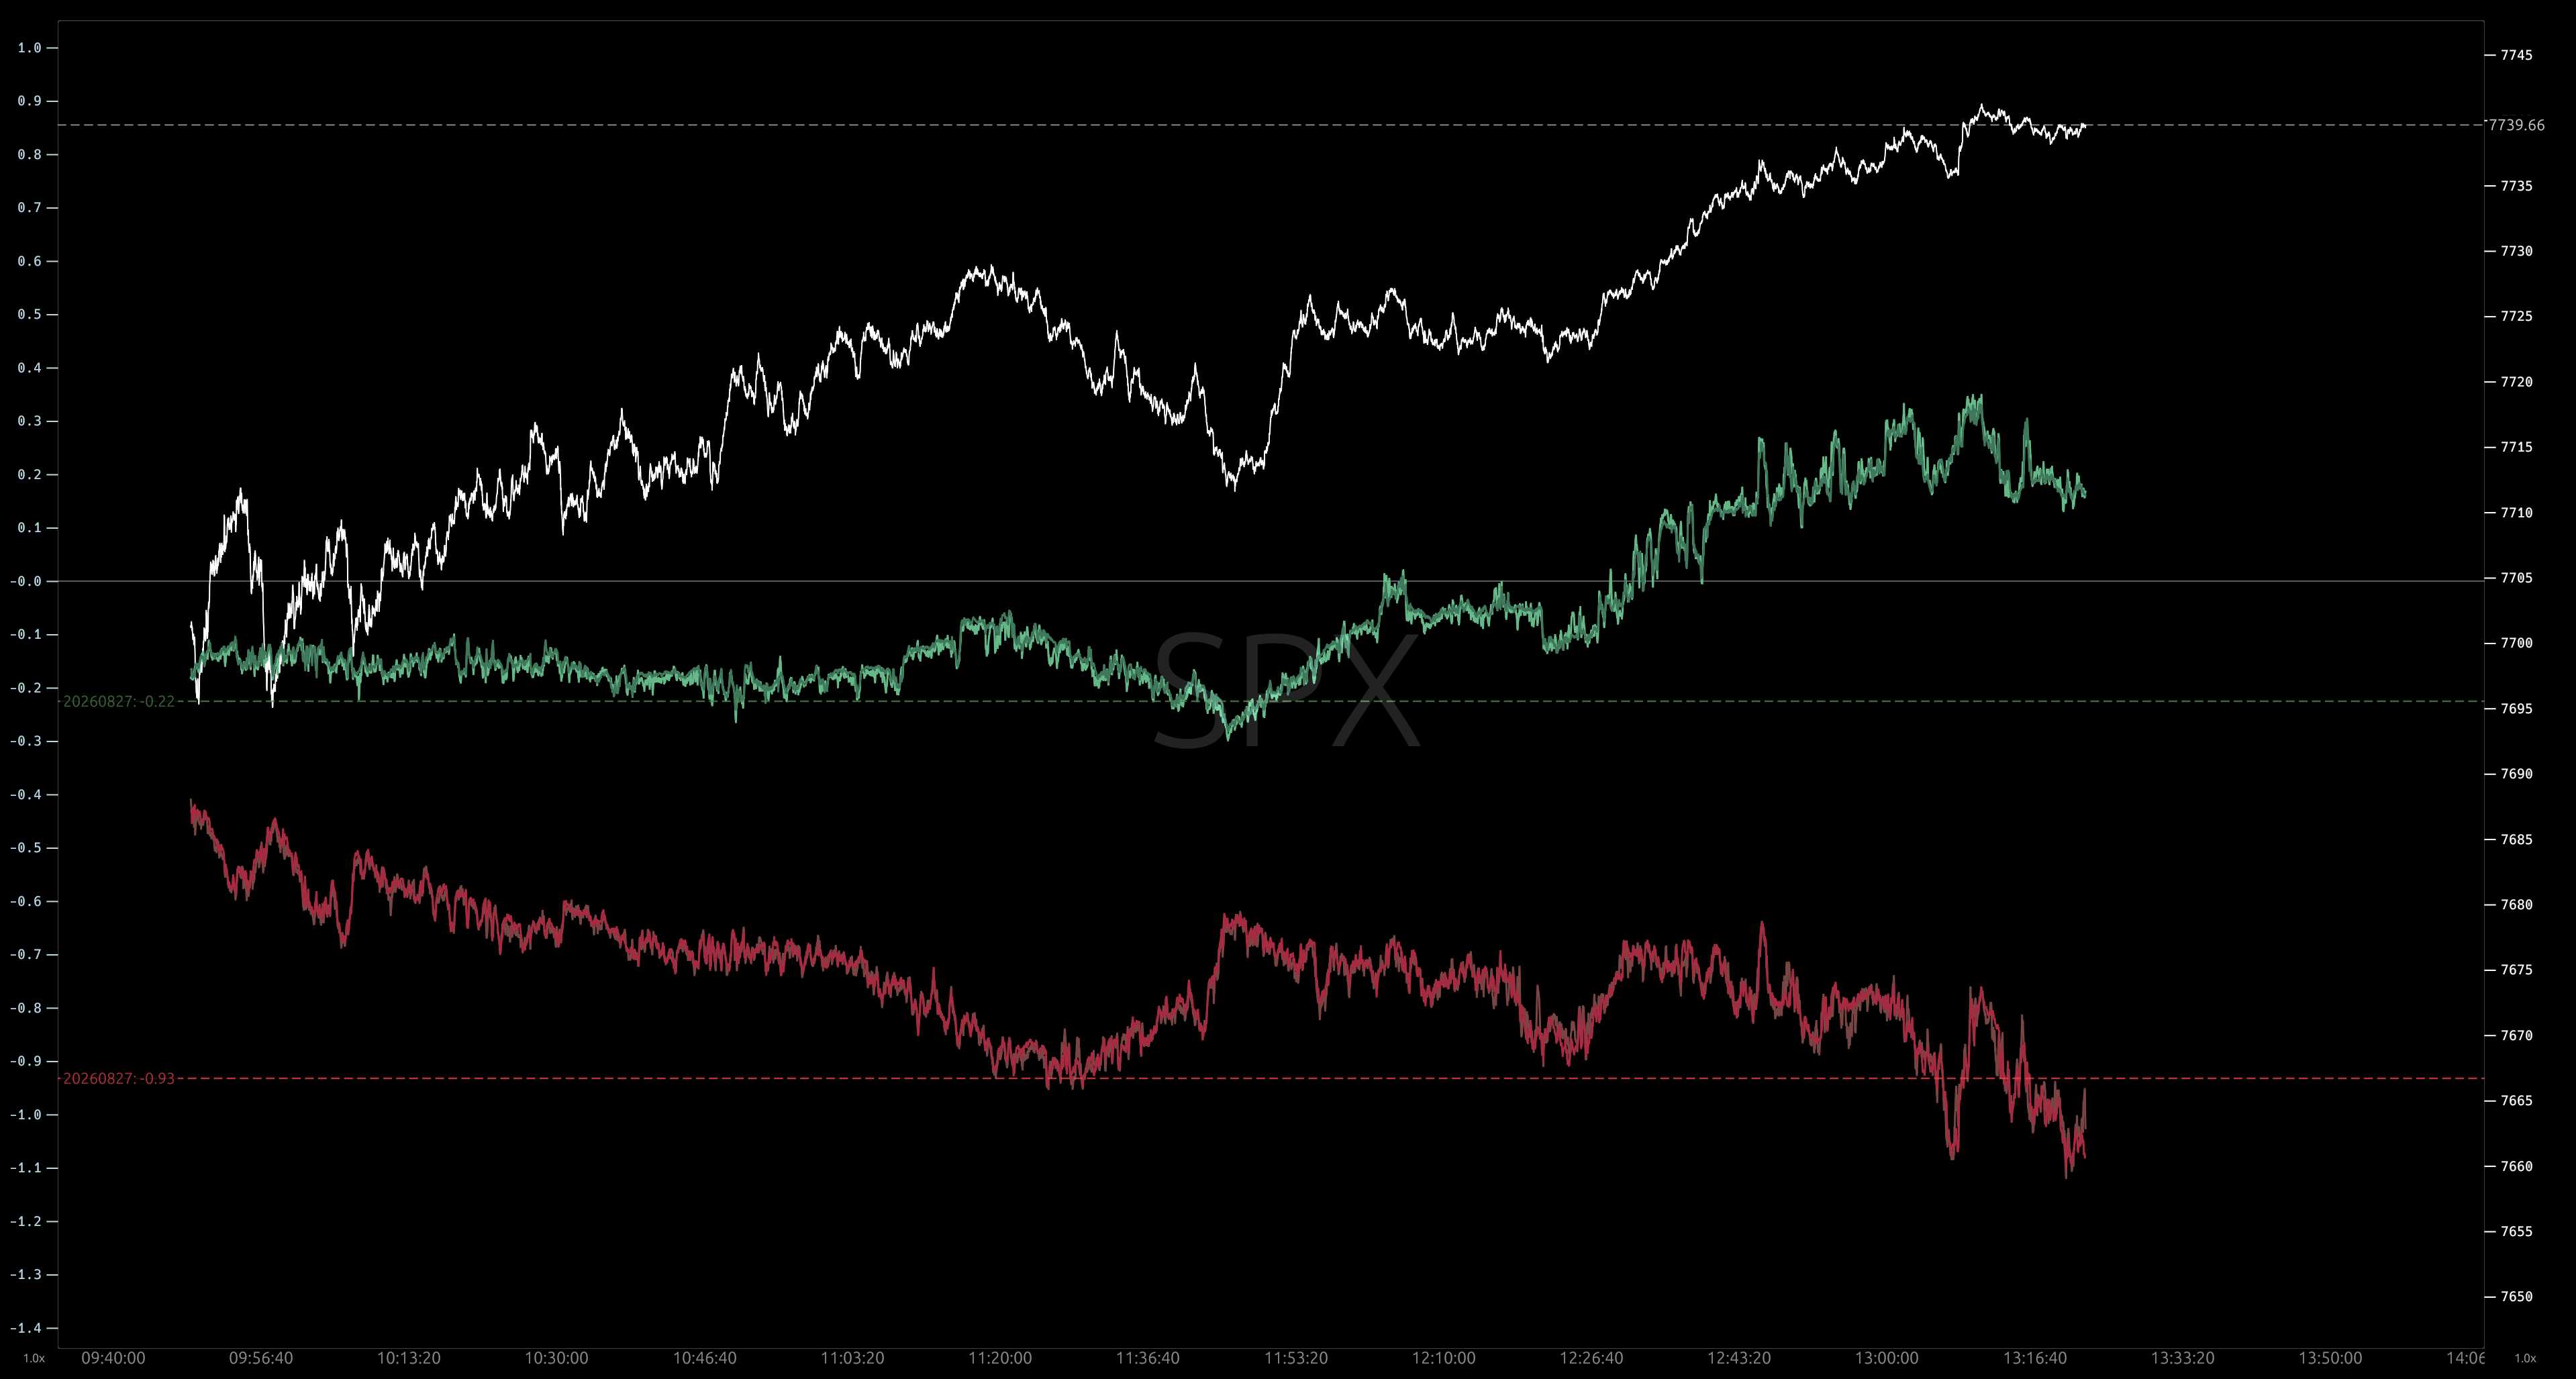
The y-axis represents the tilt scalar. Upside and downside curves are plotted in opposite directions relative to the zero line:
- Upside Tilt (Call side) is plotted as a positive value extending above the zero line. A rising upside line indicates a steeper call volatility curve.
- Downside Tilt (Put side) is plotted as a negative value extending below the zero line (scaled by -1.0). A descending downside line indicates a steeper put volatility curve.
- The Zero Line represents zero skew (a flat volatility curve with no slope).
By showing both directions simultaneously, you can see if the overall surface is experiencing symmetric demand (both wings steepening), one-sided pressure, or rotational skew shifts.
See also: tilt controls →